
Illini Basketball 2026-2027

Status
Not open for further replies.
#701      
Not historically good at all?

Let’s leave efficiency matrices by the wayside and focus on raw points per possession then.

Illinois scored the most points per possession at 1.226 than any team has in the modern era (or probably any era; I just went back about 15 years and stopped). Edged out Purdue who was at 1.225 PPP.

In your UConn vs Purdue example, you’re only considering offensive efficiency. The reason 2024 UConn was so much better than 2026 Purdue was defense: Purdue 36th vs UConn 4th.

There has been innovation in metrics/analytics by coaching in recent years, but the difference between 2024 and 2026 is minimal, if one exists at all.

The raw, unfiltered, unengineered and unmanipulated PPP record of 1.226 belongs to Illinois (unless someone corrects me and this number had been topped prior to 2010 or so).

Edit: I wonder how much NIL-era would skew numbers for a team such as Illinois. We played our most aggressive schedule to date, coupled with the fact we’re saying talent now pools at the top. So although the median team may be slightly worse, aren’t we playing more top teams, and then also those top teams are better now then they ever have been?
To compare one year against another, I think you have to at least take into account NCAA-wide scoring efficiency in addition to opponent defense.

Taking Torvik's Team AdjO divided by NCAA AdjO, Illinois was 1.206 (meaning 20.6% better than the NCAA average last year). I have data handy going back to 2018:

Year, #1 offense, #2 offense
2018: 1.229 1.181
2019: 1.192 1.186
2020: 1.187 1.180
2021: 1.232 1.222
2022: 1.199 1.189
2023: 1.183 1.169
2024: 1.213 1.195
2025: 1.224 1.198
2026: 1.220 1.206
Avg: 1.209 1.192

We were in line with most years' #1 offense, but not an all-time outlier.
 
#702      
Definitely good - but not second best all time. Do you think that Purdue team was the best offense of all time? Look at KenPom's year over year for the last 5 years. They've only escalated.

KP scores are relative to the year, they aren't generated on a historical basis. Illinois had the 2nd best KP last year, still great, but it's not a historical number.

That's why I brought up raw PPP rather than analytic/metric indexes -- the only way you manipulate raw PPP is by scheduling a bunch of poor teams, which we did the opposite.

Illinois currently holds the all-time (until someone corrects me) record for PPP at 1.226

To compare one year against another, I think you have to at least take into account NCAA-wide scoring efficiency in addition to opponent defense.

Taking Torvik's Team AdjO divided by NCAA AdjO, Illinois was 1.206 (meaning 20.6% better than the NCAA average last year). I have data handy going back to 2018:

Year, #1 offense, #2 offense
2018: 1.229 1.181
2019: 1.192 1.186
2020: 1.187 1.180
2021: 1.232 1.222
2022: 1.199 1.189
2023: 1.183 1.169
2024: 1.213 1.195
2025: 1.224 1.198
2026: 1.220 1.206
Avg: 1.209 1.192

We were in line with most years' #1 offense, but not an all-time outlier.

But in raw PPP we are 1st all-time, which probably counts for something. We played a crazy good schedule too, so its not like we scored a bunch of points per possession vs a weak schedule. I think defenses are better these days in addition to offenses being better, so 1.226 against the schedule we played was better than any other team from any other season (and the further we go back, defenses get worse, more than likely). I do think there is something to NIL-era having talent pool at the top.

EDIT: What you're doing also smears efficiency and pace, dividing by national AdjO removes context of how a team actually generates that efficiency. Additionally, Torvik's raw AdjO tries to filter for garbage time, but a simple division model treats all data points equally.
 
Last edited:
#703      
This is somewhat true, although a bit contextually inaccurate and not necessarily applied correctly; KenPom just recently wrote an article about this here:


Purdue and Illinois did have the most efficient offenses in history, but the mean efficiency has also increased significantly as coaching has become more analytics focused, so further historical context is important. KenPom attempts to contextualize this by adding the delta to the mean efficiency (which for 2026 was 109.3). Illinois' AdjOE delta to the mean was +21.7, which is ~15th best since 1997 and I would say it still puts them (and Purdue) in the "historic" category. Adjusted for respective seasons' means, Illinois' AdjOE was still better than Champions like 2025 Florida, 2024 & 2023 UConn, 2022 Kansas, 2019 Virginia, 2017 UNC, 2016 Nova, 2015 Duke, etc....


Purdue's offense was more efficient than UConn's 2024 offense, even after contextualizing it historically. I'm not using better because it's too subjective. The difference here is 2026 Purdue wasn't great defensively. The offensive approach was entirely different for 2026 and 2024 Purdue so I'm not sure how you can correctly use them for comparisons.
Great context.

Didn't account for a shift in offensive approach as much as recognizing it's the same cast of characters at the core, minus Edey. Edey was unbelievably efficient offensively. To me, the suggestion of a 26 Edey-less offense was better than their 24 offense would be a major flaw in the data. I'll apply the eye test there over data every time.

Furthermore, KP says their Defensive efficiency was 5.5 points better than the 24 Purdue team. So not only does KP data say that 26 Purdue has the best offense in 26, best offense all time, but also materially better in both offense and defense to their 24 team. Anyone with two eyeballs knows their 24 team was materially better.

What was the change in their offensive approach?
 
#704      
That's why I brought up raw PPP rather than analytic/metric indexes -- the only way you manipulate raw PPP is by scheduling a bunch of poor teams, which we did the opposite.

Illinois currently holds the all-time (until someone corrects me) record for PPP at 1.226


But in raw PPP we are 1st all-time, which probably counts for something. We played a crazy good schedule too, so its not like we scored a bunch of points per possession vs a weak schedule. I think defenses are better these days in addition to offenses being better, so 1.226 against the schedule we played was better than any other team from any other season (and the further we go back, defenses get worse, more than likely). I do think there is something to NIL-era having talent pool at the top.
Offense and defenses are better, but they aren't materially better on the aggregate than 2 years ago. Unless NASA has dropped in to provide some new age strategy I am missing, the biggest flaw in the data is that it's comparing to the middle of the pack, which has dropped immensely (23 had 2 mid majors in the F4, now a mid major can't get past the round of 32.

It is interesting to see how leaders in PPP have gone up steadily for the last 5 years. It's also an escalating stat, how much it deems "best" offense is hard to contextualize.
 
Last edited:
#705      
Offense and defenses are better, but they aren't materially better on the aggregate than 2 years ago. Unless NASA has dropped in to provide some new age strategy I am missing, the biggest flaw in the data is that it's comparing to the middle of the pack, which has dropped immensely (23 had 2 mid majors in the F4, now a mid major can't get past the round of 32.

Yes, I said as much in my previous post.

Raw PPP does not index against a median. No other team in the history of college basketball (still waiting to be corrected on this, btw) has scored 1.226 points per possession. This is how many points the team scored divided by number of possessions, no other acrobatics are done in this calculation.
 
#706      
Yes, I said as much in my previous post.

Raw PPP does not index against a median. No other team in the history of college basketball (still waiting to be corrected on this, btw) has scored 1.226 points per possession. This is how many points the team scored divided by number of possessions, no other acrobatics are done in this calculation.
That one is straight forward - yet to wrap my head around whether it's a direct correlation to "best" offense. These are interesting figures.
 
#707      
Yes, what I tracked was top 5 offense and top 45 defense.

But if you narrow it down to top 5 offense and top 30 defense, Illinois became the first team to not get a top 2 seed (despite checking those boxes).
In the span of 9 games, we lost 4 games in OT. It seems like if 1-2 of those games fall the other way, we would've been squarely in the 2-seed range. I believe bracketmatrix had us at a 2 up until we lost in OT to Wisconsin on 3/13 (for the second time).
Houston did get a bad matchup (though they played at home). Illinois was absolutely a top 8 team, but it just came down to losing games within 1-3 points.
Indeed, even though we lost to MSU it seemed like we were pretty firmly the best of the 3's, especially when we were fully healthy.
 
#708      
That one is straight forward - yet to wrap my head around whether it's a direct correlation to "best" offense. These are interesting figures.
Trying to determine "best" will be a timeless debate just because it's abstract, requires historical nuance, and there's so many stats you can rely on to argue one way or another. There's many arguments you could make for MJ being the best NBA player of all time, for Bill Russell being the best of all time, and for Lebron being the best of all time. No matter what, there will never be a majority consensus.

To your point with 24 UConn v. 26 Purdue, Purdue was the best at maximizing offensive efficiency. UConn was the best at winning basketball games in the NCAA tournament by total combined margin of victory. UConn also needed a great defense to do this, so hard to say which is "best".
 
#709      
In the span of 9 games, we lost 4 games in OT. It seems like if 1-2 of those games fall the other way, we would've been squarely in the 2-seed range. I believe bracketmatrix had us at a 2 up until we lost in OT to Wisconsin on 3/13 (for the second time).

Indeed, even though we lost to MSU it seemed like we were pretty firmly the best of the 3's, especially when we were fully healthy.
Easily. Team was 100% 2 seed caliber, if not upper 2, which is how it played out getting to the F4.

I generally saw us, UConn and Florida as the next 3. Then Iowa St, Purdue and Houston in the next three.
 
#710      
Trying to determine "best" will be a timeless debate just because it's abstract, requires historical nuance, and there's so many stats you can rely on to argue one way or another. There's many arguments you could make for MJ being the best NBA player of all time, for Bill Russell being the best of all time, and for Lebron being the best of all time. No matter what, there will never be a majority consensus.

To your point with 24 UConn v. 26 Purdue, Purdue was the best at maximizing offensive efficiency. UConn was the best at winning basketball games in the NCAA tournament by total combined margin of victory. UConn also needed a great defense to do this, so hard to say which is "best".

Not to mention all of the muddiness of not only NIL, fluctuation of median AdjO/AdjD, and even rule changes (thinking "freedom of movement" officiating epidemic: no hand-checking, block/charge arc, bumping of cutters gets whistled now, etcetera, but also the 3 point line moved back 1.5 feet in 2019)
 
#711      
Trying to determine "best" will be a timeless debate just because it's abstract, requires historical nuance, and there's so many stats you can rely on to argue one way or another. There's many arguments you could make for MJ being the best NBA player of all time, for Bill Russell being the best of all time, and for Lebron being the best of all time. No matter what, there will never be a majority consensus.

To your point with 24 UConn v. 26 Purdue, Purdue was the best at maximizing offensive efficiency. UConn was the best at winning basketball games in the NCAA tournament by total combined margin of victory. UConn also needed a great defense to do this, so hard to say which is "best".
Hear yeah - best not right word as much as effective, better yet tourney effective. Serve me up any stat that leads to smashing teams in the tournament.
 
Last edited:
#712      
Offense and defenses are better, but they aren't materially better on the aggregate than 2 years ago. Unless NASA has dropped in to provide some new age strategy I am missing, the biggest flaw in the data is that it's comparing to the middle of the pack, which has dropped immensely (23 had 2 mid majors in the F4, now a mid major can't get past the round of 32.

It is interesting to see how leaders in PPP have gone up steadily for the last 5 years. It's also an escalating stat, how much it deems "best" offense is hard to contextualize.
Even just compared to 2024, there are fewer mid-range shots (~26% of shots nationally in 2024, ~22% in 2026), and more of everything else:
1788200612516.png


You bring up a good point about the decline of the middle of the pack, but that just makes it surprising that recent top offenses don't stand out more when they are compared to the yearly mean while top (overall) teams' net efficiency has. So where has that boost in net efficiency for top overall teams come from?

Here's the AdjO+ (AdjO / NCAA average) for Torvik's #1 overall team since 2018:
1788203321720.png


And here's the AdjD- (AdjD / NCAA avg)for Torvik's #1 overall team since 2018 (lower is better):
1788203370720.png


Over this time range, the top overall team on Torvik hasn't been getting better on offense (compared to the national average), but they have on defense.

From 2018-2023, teams that were stronger on offense were weaker on defense (and vice versa) by enough to keep them all in a certain range for net efficiency. But in 2024, UConn broke that trend with the #1 offense and #4 defense- neither was historic on its own, but the combination was unique going back to at least 2018. Houston and Michigan had a similar net efficiency by pairing offenses that were typical of #1-overall teams (or slightly below) with defenses that were uniquely good.
 
#713      
Please refresh the rest of us what Morillo's injury involves.
He tweaked his back during a workout. Nothing major but spent some time on the sidelines.

Problem was it was in the thick of the practices teaching scheme and different sets.

I wouldn't be surprised if mid season everything clicks and he's a top 5 player. (Behind dre, mirc, colemen, vaaks) His talent level is that high.
 
#714      
Illinois scored the most points per possession at 1.226 than any team has in the modern era (or probably any era; I just went back about 15 years and stopped). Edged out Purdue who was at 1.225 PPP.
The raw, unfiltered, unengineered and unmanipulated PPP record of 1.226 belongs to Illinois (unless someone corrects me and this number had been topped prior to 2010 or so).
Illinois currently holds the all-time (until someone corrects me) record for PPP at 1.226
No other team in the history of college basketball (still waiting to be corrected on this, btw) has scored 1.226 points per possession.
Use Torvik for your data, because your stats are wrong.

This was Illinois points per possession in 2026:

IMG_1505.jpeg


…..

This was Purdue’s points per possession in 2026:

IMG_1506.jpeg


….

This was Duke’s points per possession in 2025:

IMG_1507.jpeg


…..

1. Duke at 1.251 (2025)
2. Illinois at 1.250 (2026)
3. Purdue at 1.248 (2026)
 
Last edited:
#715      
For instance, Purdue was 131.6 to UConn 24's 127.5. In no world was Purdue last year on the same planet as that UConn team, further evidenced in how they toyed with a much better version of them in the NC game.
Purdue points per possession last year: 1.248

UConn points per possession in 2024: 1.233

Remember, we’re talking about quality of offense (not quality of the entire team).
Last year was not the 2nd most efficient/best offense historically. They were really good, but not historically good.
the dude your opinion GIF
 
#716      
Use Torvik for your data, because your stats are wrong.

This was Illinois points per possession in 2026:

View attachment 51359


…..

This was Purdue’s points per possession in 2026:

View attachment 51360

….

This was Duke’s points per possession in 2025:

View attachment 51361

…..

1. Duke at 1.251 (2025)
2. Illinois at 1.250 (2026)
3. Purdue at 1.248 (2026)


Aw man, I was sure I was looking at PPP... wonder what I was looking at 🙃 the numbers look similar enough maybe it was another site measuring possessions differently? Weird.

Edit: Quick research uncovers that different sources do measure # of possessions differently.

So on your website (Torvik) instead of 1st by .001 we're 2nd by .001?
 
Last edited:
#718      
Even just compared to 2024, there are fewer mid-range shots (~26% of shots nationally in 2024, ~22% in 2026), and more of everything else:
View attachment 51349

You bring up a good point about the decline of the middle of the pack, but that just makes it surprising that recent top offenses don't stand out more when they are compared to the yearly mean while top (overall) teams' net efficiency has. So where has that boost in net efficiency for top overall teams come from?

Here's the AdjO+ (AdjO / NCAA average) for Torvik's #1 overall team since 2018:
View attachment 51351

And here's the AdjD- (AdjD / NCAA avg)for Torvik's #1 overall team since 2018 (lower is better):
View attachment 51352

Over this time range, the top overall team on Torvik hasn't been getting better on offense (compared to the national average), but they have on defense.

From 2018-2023, teams that were stronger on offense were weaker on defense (and vice versa) by enough to keep them all in a certain range for net efficiency. But in 2024, UConn broke that trend with the #1 offense and #4 defense- neither was historic on its own, but the combination was unique going back to at least 2018. Houston and Michigan had a similar net efficiency by pairing offenses that were typical of #1-overall teams (or slightly below) with defenses that were uniquely good.

The graph below shows overall average efficiency from 1997-2026 from KenPom. I believe the jump from 2013 to 2014 was from the 2013 rules expansion, while a number of factors have contributed to the recent rise in efficiency, including block/charge rules change, along with freedom of movement, shot selection, etc.

1788208631168.png
 
#719      
1) # possessions is not a straight-forward stat. Handling of technical fouls, free throws awarded on loose rebounds when no player is credited with a rebound, etc. Different stat databases have their own methods.
2) Someone (perhaps NarrowJ) brought this up a while ago, and I recently saw Brad on video mention: our analytical approach to recruiting values 3-point shot creation in late shot-clock scenarios. The outcomes are better than if you drive the ball. In the tournament, # fouls/game is slightly higher than in the regular season, but there are actually fewer free throws - driving is less likely to be rewarded. The guards who tormented the Illini in the regular season (Dent, Fears, Smith, Wisconsin duo) were far less successful in the tournament. I think that group collectively shot under 30% in like 11 total games.
 
#720      
In the span of 9 games, we lost 4 games in OT. It seems like if 1-2 of those games fall the other way, we would've been squarely in the 2-seed range. I believe bracketmatrix had us at a 2 up until we lost in OT to Wisconsin on 3/13 (for the second time).

Indeed, even though we lost to MSU it seemed like we were pretty firmly the best of the 3's, especially when we were fully healthy.
Last year and the TSJ year firmly lead me to believe the difference between a two seed and a three is minimal.
 
#721      
Edit: Quick research uncovers that different sources do measure # of possessions differently.
Torvik and KenPom are the most community trusted.

And Torvik’s points per possession scored (raw offense), points per possession given up (raw defense), possessions per 40 min (raw tempo) are the same as KenPom’s for every team. I’ve checked.
1) # possessions is not a straight-forward stat. Handling of technical fouls, free throws awarded on loose rebounds when no player is credited with a rebound, etc. Different stat databases have their own methods.
Illinois ppp on Torvik: 125.0
Illinois ppp on Kenpom: 125.0

Illinois raw tempo on Torvik: 65.7
Illinois raw tempo on Kenpom: 65.7

Illinois ppp defense on Torvik: 103.2
Illinois ppp defense on Kenpom: 103.2

You can do it for every team. It’s the same for those two sources.
 
Last edited:
#722      
Torvik and KenPom are the most community trusted.

And Torvik’s points per possession scored (raw offense), points per possession given up (raw defense), possessions per 40 min (raw tempo) are the same as KenPom’s for every team. I’ve checked.

Illinois ppp on Torvik: 125.0
Illinois ppp on Kenpom: 125.0

Illinois raw tempo on Torvik: 65.7
Illinois raw tempo on Kenpom: 65.7

Illinois ppp defense on Torvik: 103.2
Illinois ppp defense on Kenpom: 103.2

You can do it for every team. It’s the same for those two sources.

Seems its all in the FT rate multiplier.. some sites use .44 some use .40 some use .475

Looks like KP & Torvik both use .475 which explains why the output is 1:1
 
#723      
Seems its all in the FT rate multiplier.. some sites use .44 some use .40 some use .475

Looks like KP & Torvik both use .475 which explains why the output is 1:1
Yes.

More examples:

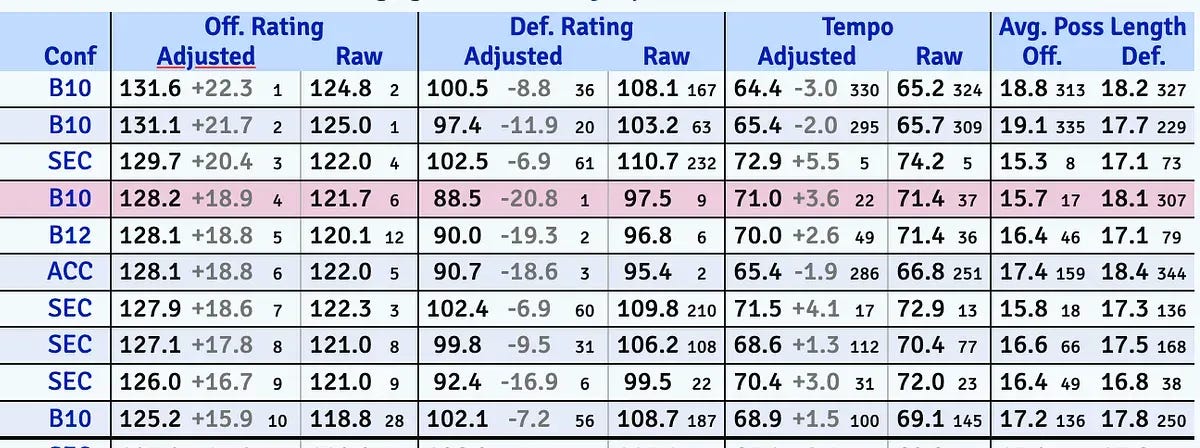
Michigan PPP on Torvik: 121.7
Michigan PPP on KenPom: 121.7

Michigan PPP defense on Torvik: 97.5
Michigan PPP defense on Kenpom: 97.5

Michigan raw tempo on Torvik: 71.4
Michigan raw tempo on Kenpom: 71.4

…..

Purdue PPP on Torvik: 124.8
Purdue PPP on Kenpom: 124.8

Purdue PPP defense on Torvik: 108.1
Purdue PPP defense on Kenpom: 108.1

Purdue raw tempo on Torvik: 65.2
Purdue raw tempo on Kenpom: 65.2

…..

Duke PPP on Torvik: 122.0
Duke PPP on Kenpom: 122.0

Duke PPP defense on Torvik: 95.4
Duke PPP defense on Kenpom: 95.4

Duke raw tempo on Torvik: 66.8
Duke raw tempo on Kenpom: 66.8

…..

One takeaway after all this baloney: playing in a bad conference boosts your points per possession (shocker).

Gonzaga had the best points per possession defense in the country at 94.2.

But, their adjusted defensive rating on Kenpom is 12th.
 
#724      
Yes.

More examples:

Michigan PPP on Torvik: 121.7
Michigan PPP on KenPom: 121.7

Michigan PPP defense on Torvik: 97.5
Michigan PPP defense on Kenpom: 97.5

Michigan raw tempo on Torvik: 71.4
Michigan raw tempo on Kenpom: 71.4

…..

Purdue PPP on Torvik: 124.8
Purdue PPP on Kenpom: 124.8

Purdue PPP defense on Torvik: 108.1
Purdue PPP defense on Kenpom: 108.1

Purdue raw tempo on Torvik: 65.2
Purdue raw tempo on Kenpom: 65.2

…..

Duke PPP on Torvik: 122.0
Duke PPP on Kenpom: 122.0

Duke PPP defense on Torvik: 95.4
Duke PPP defense on Kenpom: 95.4

Duke raw tempo on Torvik: 66.8
Duke raw tempo on Kenpom: 66.8

…..

One takeaway after all this baloney: playing in a bad conference boosts your points per possession (shocker).

Gonzaga had the best points per possession defense in the country at 94.2.

But, their adjusted defensive rating on Kenpom is 12th.
P.S. ran out of time to edit: seeing the raw ratings on Torvik is completely free. But seeing them on Kenpom requires a subscription.

I do not have a subscription to Kenpom, but Kenpom posted this screenshot on his blog (the one that RollCheif has been posting; its a free article), and from there I can compare the raw ratings he has to the raw ratings Torvik has:

IMG_1508.jpeg


His raw ratings are the same as the raw ratings listed on Torvik for each of these teams.
 
Last edited:
#725      
Purdue points per possession last year: 1.248

UConn points per possession in 2024: 1.233

Remember, we’re talking about quality of offense (not quality of the entire team).

the dude your opinion GIF
I get it. Isolating offenses alone, I don't see a close comparison. I watched a lot of both of those teams, I can't even identify where Purdue could be better. That Uconn team was lauded for having one of the most inventive and high executing offenses of the current era. The actions were constantly finding open shots, backdoor cuts, lob dunks, easy buckets and their entire starting lineup was lottery picks and drafted players.

Last year Purdue's core was TKR, Smith and Loyer, same three guys were on the team with all-world efficient Zach Edey in 2024.

This is where a data point really distorts reality. Edey opened up so much for the perimeter on that 2024 team, and he was the only NBA player on the either roster.

I wonder if there is a way to isolate these efficiencies against the top % of a schedule. Like Gonzaga often does, gaming efficiencies against a lot of mediocre opponents is something I often wonder about. Gonzaga was close to top 10 in KP most of last year and they weren't very good.

The two best offenses I've witnessed in the last 15-20 years, based on the eye test, were 2018 Nova and 2024 UConn. Both of their rosters chock full of NBA players.

It would be interesting to isolate our PPP against top 20% of schedule to see what it looks like: UConn 2x, Michigan, MSU, Purdue, Houston, Bama, Texas Tech.
 
Status
Not open for further replies.
Back