Illini Basketball 2026-2027

#626      
(Houston not too bad either with the 3rd best TOV rate and 15th best offense. Everyone who saw Houston last year knows how poor their floor spacing was, but because they didn't turn the ball over, they had a relatively efficient offense.)
That really isn't all that effective when facing Illinois, because we force the fewest turnovers in the country (while still maintaining a top 20 defense).

It wasn't something we would try to do to begin with, so having the counter of being really good at taking care of the ball wasn't all that problematic for us.

In the end, they missed a lot of perimeter jumpshots.
 
#627      
Yes, but I was talking about floors. As a floor, I don’t see us worse than a top 5 offense and a top 40 defense (unless things completely fall off the rails).

But most of all I’m trying to point out the security that comes with being elite offensively (top 5).

- - -

I actually re-checked the data, and the concept applies all the way to top 5 O / top 45 D.

*Purdue (2 seed)
*Illinois (3 seed)
Michigan (1 seed)
Auburn (1 seed)
*Alabama (2 seed)
Duke (1 seed)
Florida (1 seed)
UConn (1 seed)
Purdue (1 seed)
*Arizona (2 seed)
Gonzaga (1 seed)
*Kansas (1 seed)
*Duke (2 seed)
Gonzaga (1 seed)
Houston (2 seed)
*Baylor (1 seed)
Gonzaga (1 seed)
*Tennessee (2 seed)
Virginia (1 seed)
*Purdue (3 seed)
MSU (2 seed)
*Villanova (1 seed)
Purdue (2 seed)
Duke (2 seed)
*Kansas (1 seed)
Villanova (1 seed)
*Kentucky (4 seed)
*Michigan State (2 seed)
Kansas (1 seed)
*Wisconsin (1 seed)
*Duke (1 seed)
Villanova (1 seed)
*Gonzaga (2 seed)
*Wisconsin (2 seed)
Indiana (1 seed)
*Gonzaga (1 seed)
*Duke (2 seed)
Kentucky (1 seed)
Ohio State (1 seed)
Kansas (1 seed)
*Pitt (1 seed)
Kansas (1 seed)
Duke (1 seed)


So, for the recap: there’s 43 teams here who have entered the tournament with at least a top 5 offense and top 45 defense (since 2010).

62.8% were 1 seeds.
30.2% were 2 seeds.
4.7% were 3 seeds. (us last year and Purdue in 2019)
2.3% were 4 seeds.

Also: amongst those 43 teams, 20 of them have an asterisk (meaning top 5 offense and between 20-45 defensively; translates to elite offense and “good enough” defense).

Of those 20 teams:

40% were 1 seeds
45% were 2 seeds
10% were 3 seeds
5% were 4 seeds

- - -

The gist: when you have a top 5 offense and a defense that’s at least “good enough,” you are very likely to be a 1 or 2 seed.

Rare occasion that you fall to a 3 seed (like us last year), but honestly that’s still not terrible.
I'm assuming "before the tournament" means going to Google, searching the date to the Selection Show that year, and adjusting the dates on Torvik?

In that case - since your qualification is top 5 offense and top 45 defense - your 3 teams who weren't at least 2 seeds:

Illinois #24 defense
Purdue #41 defense
Kentucky #38 defense

And then factor in how our offense wasn't just top 5, but the 2nd best in history.

It's very unideal to come away with a 3 seed considering THAT level of resume (I'm aware it all worked out in the end).
 
#628      
There are a lot of math junkies here trying to calculate basketball championships as though it's an algorithm. While there is certainly some math involved, when you're at the top of the sport, and we are, it the becomes more about intangibles, and match ups, finding a way to be bullet-proof on both sides of the floor.
It is an algorithm to figure out WHO is "at the top of the sport."

I disagree with just assuming "we are" because you DON'T KNOW what's gonna transpire in the next 7 months (same for every other team).

If we're being honest, the list of teams who can truly win a national championship is only 3-4 each year. 15 of the last 19 natty winners have been 1 seeds.
 
Last edited:
#629      
That also does not need a "true" PG pounding the ball up top.
We don't need it, but most of all we don't want it.

Like I said: Jayden Epps is the last 6"3 or under, sub 200 pound guard that started games for us. That was in 2023. That's 3 straight seasons without that player being a starter.

And honestly, that player hasn't even played: Dra Gibbs-Lawhorn would be the closest thing, and he barely got minutes. MP basically didn't play at all. Even a guy like Justin Harmon is listed at 6"4.

The staff doesn't prioritize (or want) those players. There's just so much data on this by now, that it's ridiculous to be making this argument.
 
Last edited:
#630      
In June, Kyle Tausk ranked the incoming freshmen on potential impact this year for the Illini: 1. Coleman 2. Morillo 3. Brown 4. Zens 5. Williams 6. Davis. He has now reranked them - 1. Coleman 2. Williams 3. Brown 4. Morillo 5. Davis 6. Zens. Williams moved way up, while Morillo fell a ways.
 
#631      
In June, Kyle Tausk ranked the incoming freshmen on potential impact this year for the Illini: 1. Coleman 2. Morillo 3. Brown 4. Zens 5. Williams 6. Davis. He has now reranked them - 1. Coleman 2. Williams 3. Brown 4. Morillo 5. Davis 6. Zens. Williams moved way up, while Morillo fell a ways.
The roster was said to be set in April.

But we may have added our #8thMan in June.
 
#632      
In June, Kyle Tausk ranked the incoming freshmen on potential impact this year for the Illini: 1. Coleman 2. Morillo 3. Brown 4. Zens 5. Williams 6. Davis. He has now reranked them - 1. Coleman 2. Williams 3. Brown 4. Morillo 5. Davis 6. Zens. Williams moved way up, while Morillo fell a ways.
Morillo has been hurt - honestly all it is. Dude can play and would start this year for a bunch of teams in conference not named Illinois.

We are blessed with depth this year...it's kind of scary. Probably our most talented/deep team since the 80s.
 
#633      
It is an algorithm to figure out WHO is "at the top of the sport."

I disagree with just assuming "we are" because you DON'T KNOW what's gonna transpire in the next 7 months (same for every other team).

If we're being honest, the list of teams who can truly win a national championship is only 3-4 each year. 15 of the last 19 natty winners have been 1 seeds.

I'm trying to work out the math here, so there's only 3-4 teams that can win it each year, yet nearly 25% of the time those teams actually don't win it?

Morillo has been hurt - honestly all it is. Dude can play and would start this year for a bunch of teams in conference not named Illinois.

We are blessed with depth this year...it's kind of scary. Probably our most talented/deep team since the 80s.

That's funny, I've heard all summer how we only have 7-8 guys who have even played basketball before.
 
#635      
Morillo has been hurt - honestly all it is. Dude can play and would start this year for a bunch of teams in conference not named Illinois.

We are blessed with depth this year...it's kind of scary. Probably our most talented/deep team since the 80s.
He might be behind Williams. I don't think he's behind Brown.
 
#638      
I'm assuming "before the tournament" means going to Google, searching the date to the Selection Show that year, and adjusting the dates on Torvik?

In that case - since your qualification is top 5 offense and top 45 defense - your 3 teams who weren't at least 2 seeds:

Illinois #24 defense
Purdue #41 defense
Kentucky #38 defense

And then factor in how our offense wasn't just top 5, but the 2nd best in history.

It's very unideal to come away with a 3 seed considering THAT level of resume (I'm aware it all worked out in the end).
Yes, what I tracked was top 5 offense and top 45 defense.

But if you narrow it down to top 5 offense and top 30 defense, Illinois became the first team to not get a top 2 seed (despite checking those boxes).

- - -

Houston did get a bad matchup (though they played at home). Illinois was absolutely a top 8 team, but it just came down to losing games within 1-3 points.
 
Last edited:
#640      
Morillo has been hurt - honestly all it is. Dude can play and would start this year for a bunch of teams in conference not named Illinois.

We are blessed with depth this year...it's kind of scary. Probably our most talented/deep team since the 80s.
Please refresh the rest of us what Morillo's injury involves.
 
#642      
I'm assuming "before the tournament" means going to Google, searching the date to the Selection Show that year, and adjusting the dates on Torvik?

In that case - since your qualification is top 5 offense and top 45 defense - your 3 teams who weren't at least 2 seeds:

Illinois #24 defense
Purdue #41 defense
Kentucky #38 defense

And then factor in how our offense wasn't just top 5, but the 2nd best in history.

It's very unideal to come away with a 3 seed considering THAT level of resume (I'm aware it all worked out in the end).
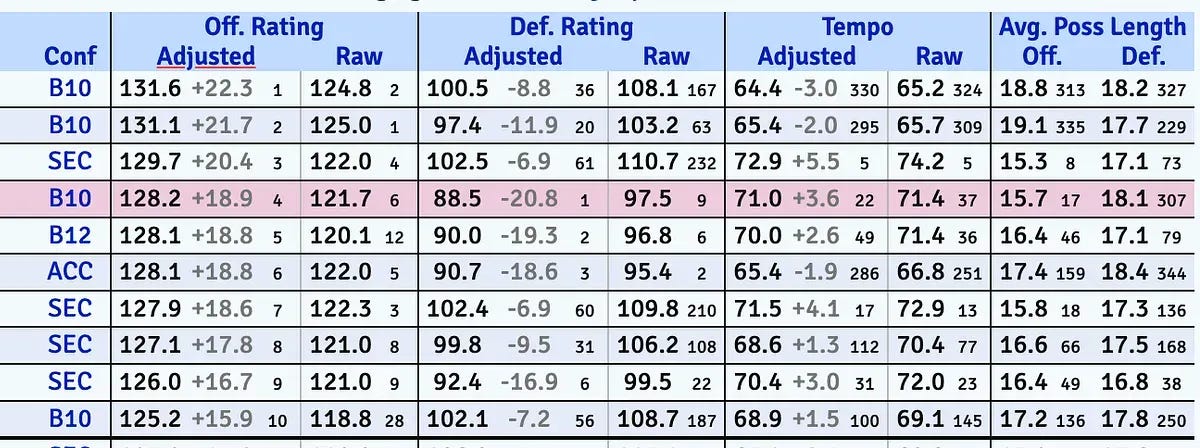
Should probably pump the breaks on historical status. KenPom's have become more and more inflated year over year because the nature of KP is evaluating against the mean, or the 177th-ish team. With how the portal/NIL have basically pushed all the talent to the top and stripped teams in the middle to not being competitive, the numbers become more an more skewed. I'd only look at KP's on an annual relative basis, not against previous or other years at this point.

For instance, Purdue was 131.6 to UConn 24's 127.5. In no world was Purdue last year on the same planet as that UConn team, further evidenced in how they toyed with a much better version of them in the NC game.

Last year was not the 2nd most efficient/best offense historically. They were really good, but not historically good.
 
#643      
Should probably pump the breaks on historical status. KenPom's have become more and more inflated year over year because the nature of KP is evaluating against the mean, or the 177th-ish team. With how the portal/NIL have basically pushed all the talent to the top and stripped teams in the middle to not being competitive, the numbers become more an more skewed. I'd only look at KP's on an annual relative basis, not against previous or other years at this point.

For instance, Purdue was 131.6 to UConn 24's 127.5. In no world was Purdue last year on the same planet as that UConn team, further evidenced in how they toyed with a much better version of them in the NC game.

Last year was not the 2nd most efficient/best offense historically. They were really good, but not historically good.

Not historically good at all?

Let’s leave efficiency matrices by the wayside and focus on raw points per possession then.

Illinois scored the most points per possession at 1.226 than any team has in the modern era (or probably any era; I just went back about 15 years and stopped). Edged out Purdue who was at 1.225 PPP.

In your UConn vs Purdue example, you’re only considering offensive efficiency. The reason 2024 UConn was so much better than 2026 Purdue was defense: Purdue 36th vs UConn 4th.

There has been innovation in metrics/analytics by coaching in recent years, but the difference between 2024 and 2026 is minimal, if one exists at all.

The raw, unfiltered, unengineered and unmanipulated PPP record of 1.226 belongs to Illinois (unless someone corrects me and this number had been topped prior to 2010 or so).

Edit: I wonder how much NIL-era would skew numbers for a team such as Illinois. We played our most aggressive schedule to date, coupled with the fact we’re saying talent now pools at the top. So although the median team may be slightly worse, aren’t we playing more top teams, and then also those top teams are better now then they ever have been?
 
Last edited:
#644      
Should probably pump the breaks on historical status. KenPom's have become more and more inflated year over year because the nature of KP is evaluating against the mean, or the 177th-ish team. With how the portal/NIL have basically pushed all the talent to the top and stripped teams in the middle to not being competitive, the numbers become more an more skewed. I'd only look at KP's on an annual relative basis, not against previous or other years at this point.
This is somewhat true, although a bit contextually inaccurate and not necessarily applied correctly; KenPom just recently wrote an article about this here:


Purdue and Illinois did have the most efficient offenses in history, but the mean efficiency has also increased significantly as coaching has become more analytics focused, so further historical context is important. KenPom attempts to contextualize this by adding the delta to the mean efficiency (which for 2026 was 109.3). Illinois' AdjOE delta to the mean was +21.7, which is ~15th best since 1997 and I would say it still puts them (and Purdue) in the "historic" category. Adjusted for respective seasons' means, Illinois' AdjOE was still better than Champions like 2025 Florida, 2024 & 2023 UConn, 2022 Kansas, 2019 Virginia, 2017 UNC, 2016 Nova, 2015 Duke, etc....

For instance, Purdue was 131.6 to UConn 24's 127.5. In no world was Purdue last year on the same planet as that UConn team, further evidenced in how they toyed with a much better version of them in the NC game.
Purdue's offense was more efficient than UConn's 2024 offense, even after contextualizing it historically. I'm not using better because it's too subjective. The difference here is 2026 Purdue wasn't great defensively. The offensive approach was entirely different for 2026 and 2024 Purdue so I'm not sure how you can correctly use them for comparisons.

 
#645      
Not historically good at all?

Let’s leave efficiently matrices by the wayside and focus on raw points per possession then.

Illinois scored the most points per possession at 1.226 than any team has in the modern era (or probably any era; I just went back about 15 years and stopped). Edged out Purdue who was at 1.225 PPP.

In your UConn vs Purdue example, you’re only considering offensive efficiency. The reason 2024 UConn was so much better than 2026 Purdue was defense: Purdue 36th vs UConn 4th.

There has been innovation in metrics/analytics by coaching in recent years, but the difference between 2024 and 2026 is minimal, if one exists at all.

The raw, unfiltered, unengineered and unmanipulated PPP record of 1.226 belongs to Illinois (unless someone corrects me and this number had been topped prior to 2010 or so).
Definitely good - but not second best all time. Do you think that Purdue team was the best offense of all time? Look at KenPom's year over year for the last 5 years. They've only escalated.

KP scores are relative to the year, they aren't generated on a historical basis. Illinois had the 2nd best KP last year, still great, but it's not a historical number.
 
#646      
Not historically good at all?

Let’s leave efficiency matrices by the wayside and focus on raw points per possession then.

Illinois scored the most points per possession at 1.226 than any team has in the modern era (or probably any era; I just went back about 15 years and stopped). Edged out Purdue who was at 1.225 PPP.

In your UConn vs Purdue example, you’re only considering offensive efficiency. The reason 2024 UConn was so much better than 2026 Purdue was defense: Purdue 36th vs UConn 4th.

There has been innovation in metrics/analytics by coaching in recent years, but the difference between 2024 and 2026 is minimal, if one exists at all.

The raw, unfiltered, unengineered and unmanipulated PPP record of 1.226 belongs to Illinois (unless someone corrects me and this number had been topped prior to 2010 or so).

Edit: I wonder how much NIL-era would skew numbers for a team such as Illinois. We played our most aggressive schedule to date, coupled with the fact we’re saying talent now pools at the top. So although the median team may be slightly worse, aren’t we playing more top teams, and then also those top teams are better now then they ever have been?
To compare one year against another, I think you have to at least take into account NCAA-wide scoring efficiency in addition to opponent defense.

Taking Torvik's Team AdjO divided by NCAA AdjO, Illinois was 1.206 (meaning 20.6% better than the NCAA average last year). I have data handy going back to 2018:

Year, #1 offense, #2 offense
2018: 1.229 1.181
2019: 1.192 1.186
2020: 1.187 1.180
2021: 1.232 1.222
2022: 1.199 1.189
2023: 1.183 1.169
2024: 1.213 1.195
2025: 1.224 1.198
2026: 1.220 1.206
Avg: 1.209 1.192

We were in line with most years' #1 offense, but not an all-time outlier.
 
#647      
Definitely good - but not second best all time. Do you think that Purdue team was the best offense of all time? Look at KenPom's year over year for the last 5 years. They've only escalated.

KP scores are relative to the year, they aren't generated on a historical basis. Illinois had the 2nd best KP last year, still great, but it's not a historical number.

That's why I brought up raw PPP rather than analytic/metric indexes -- the only way you manipulate raw PPP is by scheduling a bunch of poor teams, which we did the opposite.

Illinois currently holds the all-time (until someone corrects me) record for PPP at 1.226

To compare one year against another, I think you have to at least take into account NCAA-wide scoring efficiency in addition to opponent defense.

Taking Torvik's Team AdjO divided by NCAA AdjO, Illinois was 1.206 (meaning 20.6% better than the NCAA average last year). I have data handy going back to 2018:

Year, #1 offense, #2 offense
2018: 1.229 1.181
2019: 1.192 1.186
2020: 1.187 1.180
2021: 1.232 1.222
2022: 1.199 1.189
2023: 1.183 1.169
2024: 1.213 1.195
2025: 1.224 1.198
2026: 1.220 1.206
Avg: 1.209 1.192

We were in line with most years' #1 offense, but not an all-time outlier.

But in raw PPP we are 1st all-time, which probably counts for something. We played a crazy good schedule too, so its not like we scored a bunch of points per possession vs a weak schedule. I think defenses are better these days in addition to offenses being better, so 1.226 against the schedule we played was better than any other team from any other season (and the further we go back, defenses get worse, more than likely). I do think there is something to NIL-era having talent pool at the top.

EDIT: What you're doing also smears efficiency and pace, dividing by national AdjO removes context of how a team actually generates that efficiency. Additionally, Torvik's raw AdjO tries to filter for garbage time, but a simple division model treats all data points equally.
 
Last edited:
#648      
This is somewhat true, although a bit contextually inaccurate and not necessarily applied correctly; KenPom just recently wrote an article about this here:


Purdue and Illinois did have the most efficient offenses in history, but the mean efficiency has also increased significantly as coaching has become more analytics focused, so further historical context is important. KenPom attempts to contextualize this by adding the delta to the mean efficiency (which for 2026 was 109.3). Illinois' AdjOE delta to the mean was +21.7, which is ~15th best since 1997 and I would say it still puts them (and Purdue) in the "historic" category. Adjusted for respective seasons' means, Illinois' AdjOE was still better than Champions like 2025 Florida, 2024 & 2023 UConn, 2022 Kansas, 2019 Virginia, 2017 UNC, 2016 Nova, 2015 Duke, etc....


Purdue's offense was more efficient than UConn's 2024 offense, even after contextualizing it historically. I'm not using better because it's too subjective. The difference here is 2026 Purdue wasn't great defensively. The offensive approach was entirely different for 2026 and 2024 Purdue so I'm not sure how you can correctly use them for comparisons.

Great context.

Didn't account for a shift in offensive approach as much as recognizing it's the same cast of characters at the core, minus Edey. Edey was unbelievably efficient offensively. To me, the suggestion of a 26 Edey-less offense was better than their 24 offense would be a major flaw in the data. I'll apply the eye test there over data every time.

Furthermore, KP says their Defensive efficiency was 5.5 points better than the 24 Purdue team. So not only does KP data say that 26 Purdue has the best offense in 26, best offense all time, but also materially better in both offense and defense to their 24 team. Anyone with two eyeballs knows their 24 team was materially better.

What was the change in their offensive approach?
 
#649      
That's why I brought up raw PPP rather than analytic/metric indexes -- the only way you manipulate raw PPP is by scheduling a bunch of poor teams, which we did the opposite.

Illinois currently holds the all-time (until someone corrects me) record for PPP at 1.226


But in raw PPP we are 1st all-time, which probably counts for something. We played a crazy good schedule too, so its not like we scored a bunch of points per possession vs a weak schedule. I think defenses are better these days in addition to offenses being better, so 1.226 against the schedule we played was better than any other team from any other season (and the further we go back, defenses get worse, more than likely). I do think there is something to NIL-era having talent pool at the top.
Offense and defenses are better, but they aren't materially better on the aggregate than 2 years ago. Unless NASA has dropped in to provide some new age strategy I am missing, the biggest flaw in the data is that it's comparing to the middle of the pack, which has dropped immensely (23 had 2 mid majors in the F4, now a mid major can't get past the round of 32.

It is interesting to see how leaders in PPP have gone up steadily for the last 5 years. It's also an escalating stat, how much it deems "best" offense is hard to contextualize.
 
Last edited:
#650      
Offense and defenses are better, but they aren't materially better on the aggregate than 2 years ago. Unless NASA has dropped in to provide some new age strategy I am missing, the biggest flaw in the data is that it's comparing to the middle of the pack, which has dropped immensely (23 had 2 mid majors in the F4, now a mid major can't get past the round of 32.

Yes, I said as much in my previous post.

Raw PPP does not index against a median. No other team in the history of college basketball (still waiting to be corrected on this, btw) has scored 1.226 points per possession. This is how many points the team scored divided by number of possessions, no other acrobatics are done in this calculation.
 
Back