Recruiting Talent vs. Conference Standings

#1      
Yesterday I posted in the "Looking back thread" that I decided I would dive into getting data on the "talent ranking" of each B1G team over the course of the season, and also seeing how that relates to finishing position in the conference.

In case you don't want to read that post, what I've done is determined a talent rating for each team for the last 10 seasons played + the upcoming season by taking the average of the 247 Composite rating of each scholarship player on the roster. If a player is on roster and did not receive a rating, they received a rating of 0.7, equal to the lowest rating I've seen on 247. For simplicity's sake, I've also included every player listed on the roster for that season, even if they were red-shirting as a transfer (think Rayvonte Rice 2012-13) or injured for the season (think Tracy Abrams 2014-15 & 2015-16). While I know it's not necessarily perfect, it was the best way for me to quickly put this together without researching every Big Ten team in depth for the last 10 seasons.

Now for some results!

This first graph attempts to answer Second and Chalmers' original question which inspired this research: "If order of finish in the Big Ten were determined strictly by recruiting rankings". I tried to color each team by roughly their team color, but that becomes an issue with all the red in this conference.

Recruiting Talent Ranking.PNG

One of the most interesting things to me looking at this is how the conference goes from having some defined "tiers" in recurring talent level in the earlier years shown, to having more teams jump up and down the rankings in more recent seasons. Also notable is that Illinois is currently at our lowest rank in talent relative to the rest of the conference in the last 10 years, but that is still 7th in the conference.

Next graph shows the relative talent level of each team, rather than the ranking. This one does an even better job of highlighting the talent parity in the conference over the last few years.

Talent Level.PNG


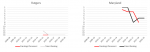
Final graph shows Illinois' rank in the Big 10 in talent level vs. our actual finishing position in the conference standings. I used overall record as a tie-breaker for conference records. I don't think I need to point out the picture that this graph tells about our on-court performance over the last 10 years.

Illinois.PNG


I can do these for each team in the B1G upon request. I didn't want to post all 14 right off the bat. If anyone has any questions that they think could be answered by this data let me know! Or if you have any ideas of how to better display this information I'm open to that as well!
 
#2      
Not a whole lot of difference in talent level according to that 2nd graph. Which is why having no positional gaps, competent coaching, experienced players, and good health are really important. The last time we could say we've had that was 2012-2013 when we made the tournament.
 
#3      
Excellent analytical data here! This is the type of research "sports analysts" on ESPN should be doing. Awesome job!
 
#4      
That's really amazing, interesting work and thank you so much for putting the time in for our benefit. You're inspiring me to actually go do the work for a little project I've had rattling around in my head for awhile.

Out of curiosity, what are you using to make those graphs?
 
#5      
This is a great thread. Thanks for your leg work! But I really hate that downward trend on the dark line in the 3rd graph. Can you "fix" the data so it doesn't do that?
 
#6      
I don't think I need to point out the picture that this graph tells about our on-court performance over the last 10 years.

View attachment 3504

I can do these for each team in the B1G upon request. I didn't want to post all 14 right off the bat. If anyone has any questions that they think could be answered by this data let me know! Or if you have any ideas of how to better display this information I'm open to that as well!

Let me make the implicit explicit: after 08-09 we've underperformed our recruiting level, by at least two places, every single season.

The question that springs to mind is whether any other program in the conference shows as consistent of a trend either overperforming or undeperforming? Iowa looks like a big overperformer, just eyeballing it.

The consistency with which we've had higher ranked recruits than Purdue and Michigan over the past decade just explodes off the page, to my eyes.
 
#7      
That's really amazing, interesting work and thank you so much for putting the time in for our benefit. You're inspiring me to actually go do the work for a little project I've had rattling around in my head for awhile.

Out of curiosity, what are you using to make those graphs?

I did everything out of Excel.
 
#8      
Let me make the implicit explicit: after 08-09 we've underperformed our recruiting level, by at least two places, every single season.

The question that springs to mind is whether any other program in the conference shows as consistent of a trend either overperforming or undeperforming? Iowa looks like a big overperformer, just eyeballing it.

The consistency with which we've had higher ranked recruits than Purdue and Michigan over the past decade just explodes off the page, to my eyes.

I believe this table should help answer your question. I sorted based first off the number of seasons above the talent rank, then by match, then by below.

Performance Table.PNG
 
#9      

CAIllini

West Coast
Interesting stuff...I'd love to see a graph of the standings vs. talent gap for all teams over that time period. We seem to be averaging almost 5 places different based on this data which is crazy high.

Another thing that might be easy"ish" to do without researching teams in depth assuming year in school data is available in your dataset would be to augment each player's composite rankings with a scaling factor for year in school. Maybe modifier like F=0.8, So=1, Jr=1.1, Sr=1.2 or something like that....(make them variables in your model). Then we could play around with accounting for team experience in the data.

If you wanted to take it even further and if position (1-5) was listed in your database, you could try to analyze roster balance and or see which teams do a good/better job of recruiting big vs. guards vs. wings....

Great work!

At least it's something to talk about while our teams suck :(
 
#16      

CAIllini

West Coast
Let me make the implicit explicit: after 08-09 we've underperformed our recruiting level, by at least two places, every single season.

The average gap is way way worse than 2 positions....so very bad. We must have the worst average gap in the league over that period.

I'd still love to see a graph of the standings vs. talent gap for all teams over that time period...should tell us everything we need to know. If you want I can throw it together quickly if you share the dataset. (can you tell it's a Friday and I don't want to be at work!!!)
 
#17      

ILL in IA

Iowa City
Very much confirms my prior that Fran and Chambers are damn good game coaches.

But, you could just as much see it as an indictment on their ability to get players, especially at Iowa.
In regards to Fran, he has had a good core of 4-5 guys with some really good talent, but not a lot of depth. And his core players remained his core over 3-4 seasons with some big recruiting gaps. He rode that Woodbury, Gesell, class as starters for 4 years. His biggest success as Iowa had basically the same starting 5 for 3 straight years, then rolled that into a new group of fresh/sophs to start for 3 more.

Maybe some success can be hand with little turnover and continuity...
 
#18      
It may just reflect the data getting less kludgy over time, but it sure looks like the teams are getting more even in talent level.

And this deserves its own thread just out of respect for the work put into the OP. If it causes that other thread to descend down the page, so be it.
 
#19      
The average gap is way way worse than 2 positions....so very bad. We must have the worst average gap in the league over that period.

I'd still love to see a graph of the standings vs. talent gap for all teams over that time period...should tell us everything we need to know. If you want I can throw it together quickly if you share the dataset. (can you tell it's a Friday and I don't want to be at work!!!)

You act like I don't have anything better to do!

Team Graphs Pt 1.PNG

Team Graphs Pt 2.PNG

Team Graphs Pt 3.PNG
 

Attachments

  • Team Graphs Pt 3.PNG
    Team Graphs Pt 3.PNG
    13 KB · Views: 256
#20      
It seemed to me that a big part of our problem was positional balance, I.e. Pg and ctr. Too much work but would be interested to see if you just use the ranking for the top ten players mins wise. That would tend to balance having eight wings with high rankings and low rankings at the other positions. Also like the idea of adding points for yrs of experience. Kane may very well be much better as a senior center than a high 4 star freshman.
 
#22      
It may just reflect the data getting less kludgy over time, but it sure looks like the teams are getting more even in talent level.

And this deserves its own thread just out of respect for the work put into the OP. If it causes that other thread to descend down the page, so be it.

I think the talent level is getting more even across the conference, but I also think it's possible there are some differences in how the 247 composite ends up getting its ratings for recruits of certain rankings.
 
#24      

BananaShampoo

Captain 'Paign
Phoenix, AZ
Dear God. This is both good and terrifying stuff. Thanks for putting it together, Soupy. I wonder how a similar graph showing average experience would correlate. I suspect it would be even more of a correlation. If BU can be at least as good as a Fran or DeChellis then good times are ahead, because what this tells me is that talentwise we've had the horses to compete. It's clearly been the coaching that's the problem, positional deficiencies and bad luck (injuries) notwithstanding.
 
#25      

illini80

Forgottonia
Thanks Soupy for a great analysis! I think half the arguments on here just need a link to this thread.